Measuring the impact of inclusive representation in content
Table of Contents
Introduction
Our customers and analysts ask us two questions while evaluating krita.ai products.
How do we know that our content is inclusive?
How do we measure the impact of inclusive content?
In this blog we provide recommended metrics that address both these questions, which is an outcome of our research and direct customer inputs gathered over the past 9 months. In summary, the metrics we need to put in place for the questions above are:
Metrics for “is my content inclusive”: a degree / measure of representative and bias free content that you post. (i.e. content free of microaggressions, unconscious bias, non representative, toxicity and context insensitivity)
Metrics for “impact of inclusive content”: this is through improved customer attraction, retention, reduced attrition, conversion metrics and anecdotal testimonies via direct people feedback.
We will elaborate on how we arrived at these metrics in detail below.
Foundations of inclusive content
Inclusive organization
McKinsey defines inclusion in an enterprise as “the degree to which an individual feels that their authentic selves are welcomed at work, enabling them to contribute in a meaningful and deliberate manner”. An individual’s sense of inclusion is influenced by their experiences with the organization as a whole, the organization’s leaders, and peers or team members.
Research has also established that Diverse companies outperform their peers financially and also in the rate of innovation. Hence, Diversity is the outcome that companies need to achieve. In order to do that, they need to make inclusion their goal, thereby shifting their focus to actual behaviors.
The actual behaviors (or differently put, the degree of inclusion) is reflected in the content a company puts out. Inclusion matters in content because:
Marketing content: There is a 300% increase in purchase intent of the product when the ads are seen as inclusive.
Conversations and collaboration: $223Bn is the cost of turnover due to workplace culture in the past 5 years.
Talent experience content: 39% of people say they have turned down or decided not to pursue a job because of a perceived lack of inclusion at an organization. This turn down rate is much higher in minority sub-groups.
What is Inclusive content?
Inclusion in content is defined as “content that truly reflects the diverse communities that our companies serve. It means that we are elevating diverse voices and role models, decreasing cultural bias, and leading positive social change through thoughtful and respectful content.”
The purpose of any content an organization produces is to attract, retain, nurture and drive the audience to profitable action. In a research conducted by Microsoft advertising almost two-thirds (64%) of the people they surveyed said that they were more trusting of the brands that represent diversity in their ads. About the same number (63%) said that the brands that represent diversity in their ads are more authentic. Hence, inclusive content impacts customers, employees and talent in a significant way.
How do you know that your content is inclusive?
There is no 100% inclusive content. However, you can measure the degree of inclusion in your content by assessing what it contains and what it does not contain. This means:
What the content should contain: Your content, whether as a standalone piece or as a collection, should truly reflect the diverse communities that your company serves.
What the content must not contain: is bias, context insensitivity, microaggressions and any form of toxicity.
Having laid this foundation, let’s explore the metrics you can use to track how inclusive your content is:
Metrics to track degree of inclusion in your content
In the previous section, we discussed how you can determine if your content is inclusive. The metrics we put in place should reveal the measure of diversity the content serves, either as an individual piece or as a collective set. Here is a suggested list of metrics any organization can put in place:
Metric 1: Tone measure
Content is analyzed for words and phrases that have a greater relatability to a specific demographic (example: gender coded, ethnic coded, race coded words).
1. Total instances of coded Phrases / unconscious bias that were found in the content analyzed.
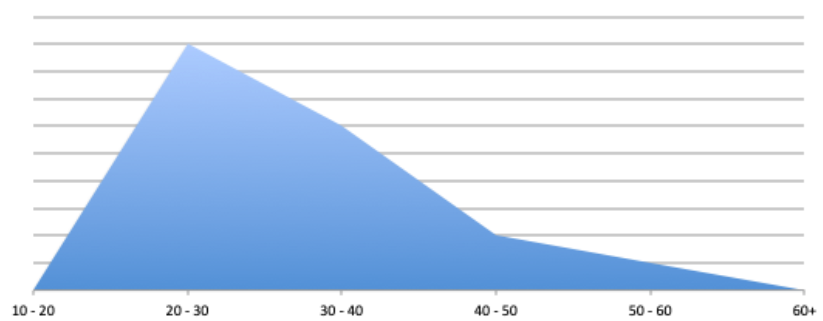
2. Tone affinity meter to specific groups. below we show a sample of tone meter corresponding to two gender groups (male vs female).

3. Tone affinity graph: Alternate way to look at the tone of the content and who it represents. In below example, we give the age group the content represents more than others.
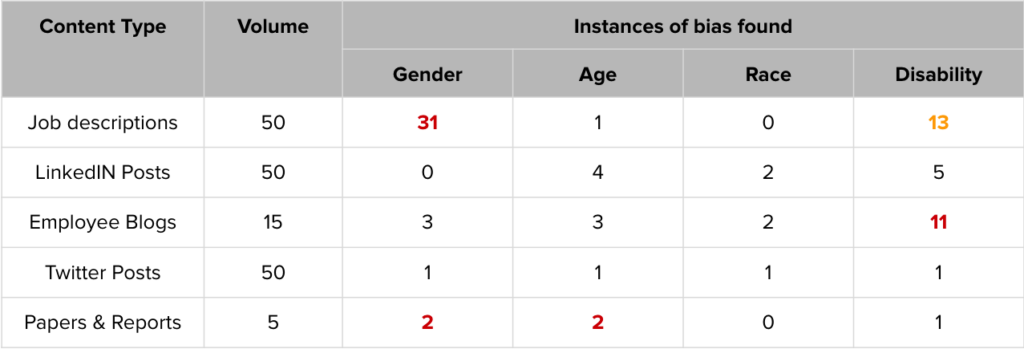
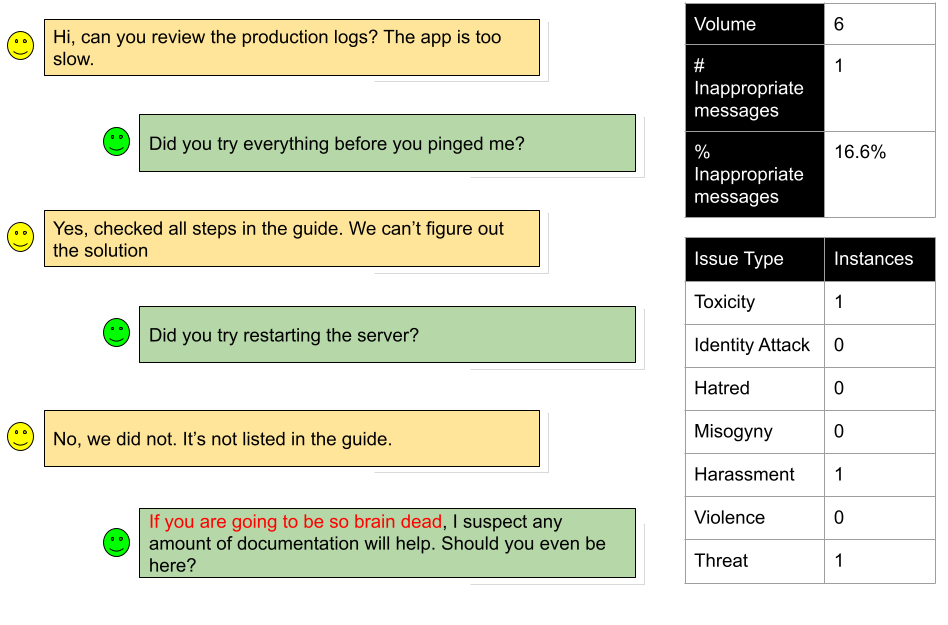
Metric 2: % of inappropriate content
This is based on the % of instances where explicit and implicit microaggressions, stereotype, bias, toxicity or cultural insensitivity is detected. This metric is especially useful when dealing with user generated content, or BOT generated content. The metrics include:
- Total instances of inappropriate content found. Aggregate based on each issue category (microaggression, bias, abuse, toxicity, hatred, culture blunder etc).
- % of content found inappropriate amongst the total content.
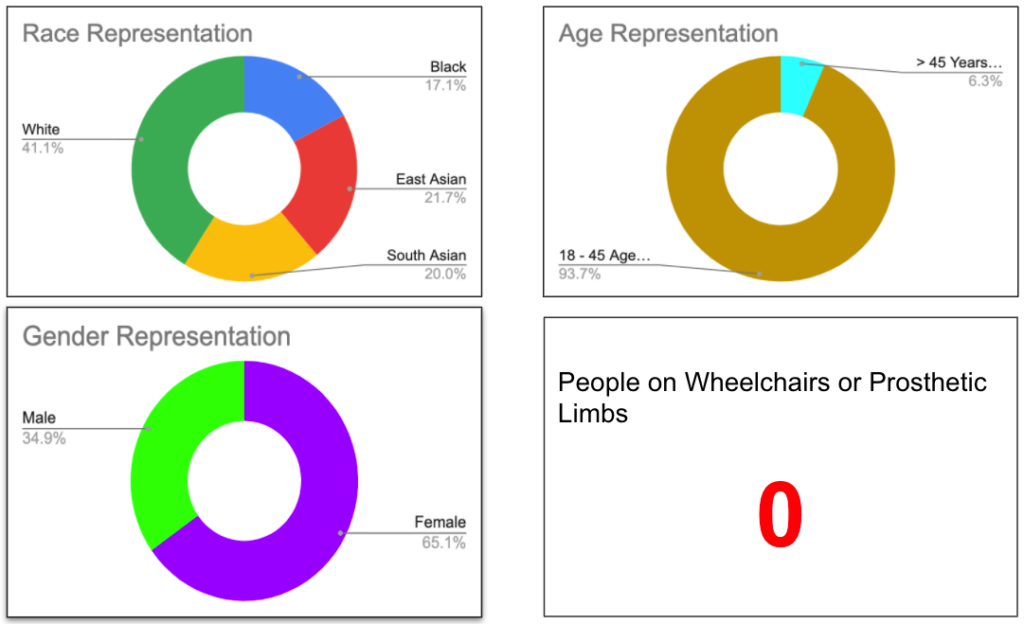
Metric 3: % representation of diverse groups
- Representation of various demographics within the content based on Gender, Race, Age, Disability, Sexual orientation etc.
- Benchmark against desired demographic split and industry peers.
Example: Inspired by how companies like Vanguard have started reporting their diversity in the board, we provide an example of how companies can start tracking demographics of people they represent in their online content, especially in images & video.
Metric 4: % relevance
- In the case of an individual piece of content, it’s a graded measure (Not representative, somewhat representative, is representative ) of whether the content represents the context.
- For collection of content, aggregate value of total content that is out of context.

In this case the Representation score is probably – somewhat representative, because the people shown in the image are not representative of the geography where this job ad is distributed, but it’s an office setting.
Metrics to track impact of inclusive content
While there are many metrics to measure inclusion in an organization, we focus here on content that impacts inclusion. There are primarily three categories of metrics that inclusive content influences:
- Conversion rates: Baseline your current conversion ratios. Measure the shift in conversion ratios (by basis points) as you create more inclusive content. The conversion ratios you can track include
- Impressions → Leads → Sales → Closure. These conversion ratios can be tracked for both talent marketing, brand and product marketing content.
- Demographics of converted people: For customers and talent who walk in, what is their demographic split vs the actual representative demographic split of the company’s customers. This tells us the people we are able to attract and the opportunity lost.
- Sentiment analysis: How do your users feel about your content as they like, share, and comment on it across the many platforms. Measure the % of shift in sentiment as you move towards creating more inclusive content.
We also recommend using anecdotal references/ feedback from your target audience on how relevant and inclusive the content the company puts out.
Impact metrics can be tracked within the ATS/CRM/Marketing Automation/Collaboration platforms.